Summary
A demonstration analytics platform that transforms a synthetic ticket dataset into SLA, backlog, MTTR, risk, and root-cause indicators.
Project case study
Operational BI for SLA, backlog, and incidents.
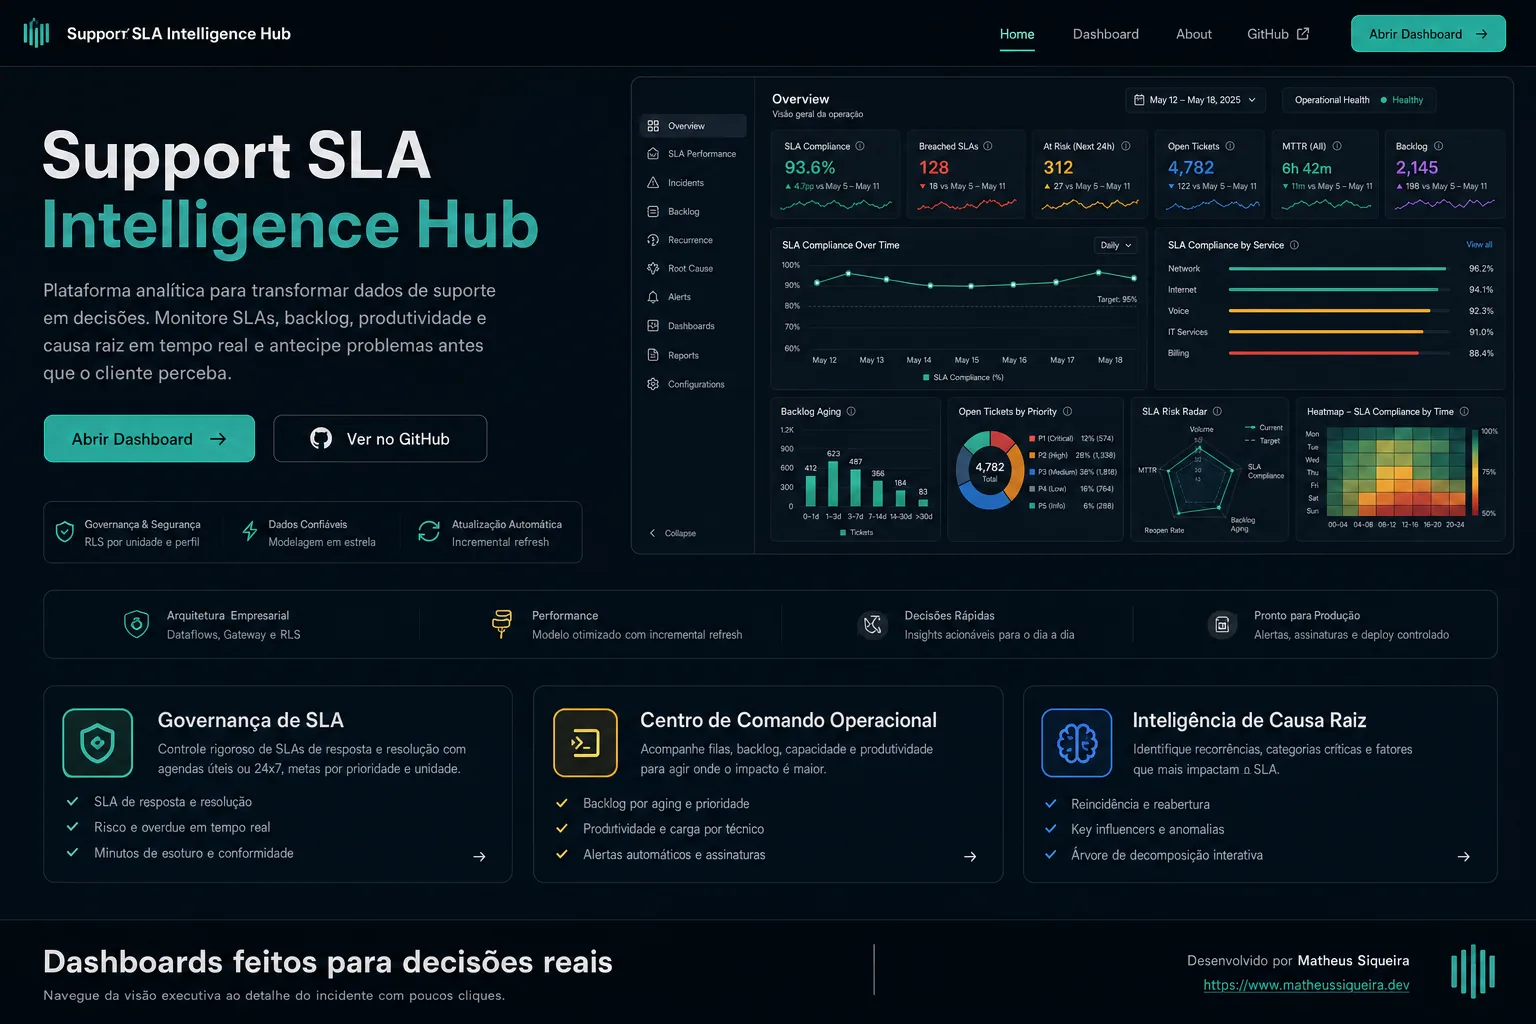
A demonstration analytics platform that transforms a synthetic ticket dataset into SLA, backlog, MTTR, risk, and root-cause indicators.
Support operations may face fragmented data, limited visibility into SLA breaches, and difficulty prioritizing critical tickets.
Indicator definition, scenario modeling, interface development, visualization implementation, and technical documentation.
The 780 tickets are synthetic, deterministic, and contain no real personal data. The seed can persist the same records in PostgreSQL without changing their simulated nature; there is no active integration with an ITSM platform.
The flow keeps data, contracts, rules, and visualization separate so the demonstration source can be replaced without rewriting indicators or components.
Catalogs, SLA policies, and the generator in src/data produce a reproducible dataset; the seed can copy the same records into PostgreSQL.
The Ticket type standardizes each record, while the repository layer selects mock or database and normalizes both to the same contract.
Pure functions in src/lib apply filters, groupings, SLA, backlog, MTTR, recurrence, trends, and risk scoring.
tRPC routers and Route Handlers reuse the same functions to deliver summaries and series to the product's different views.
Next.js and Recharts components organize KPIs, charts, filters, tables, and exports across executive, operational, SLA, and root-cause views.
The definitions below match the functions and rules documented in the repository. No formula was added only for the portfolio.
| Definition | Unit | Calculation rule | Use | Limitation |
|---|---|---|---|---|
| SLA compliancePercentage of tickets with an applicable resolution SLA marked as met. | % | Tickets with resolutionSlaMet = true ÷ tickets where resolutionSlaMet is not null. | Monitor resolution deadline compliance in the scenario. | The historical view uses synthetic targets and times; Analytics v2 provides a complementary business-hours view. |
| BacklogTickets in open, in-progress, pending, or awaiting-vendor status. | Tickets | Count of records that belong to the four open statuses. | Evaluate pending workload and aging distribution. | Represents a snapshot at the demonstration dataset's fixed clock. |
| MTTRAverage resolution time for resolved or closed tickets. | Minutes or hours | Average resolutionTimeMinutes for tickets with a recorded resolution. | Compare resolution efficiency across filters and dimensions. | Times are generated by the synthetic scenario, not measured in a live operation. |
| At-risk ticketsOpen tickets with resolution deadline consumption between 75% and 100%. | Tickets | Elapsed minutes ÷ resolutionSlaMinutes, including consumption greater than or equal to 75% and below 100%. | Demonstrate preventive prioritization before a breach. | The historical rule uses elapsed minutes; the v2 layer also calculates risk in business hours. |
| Operational severityCritical-ticket slice based on P1 and P2 priorities. | Tickets | Count of tickets where priority equals P1 or P2. | Highlight tickets with higher potential impact. | Priority is assigned by the synthetic generator, not by real human triage. |
| ProductivityOperational profile by technician with open, closed, overdue, SLA, and reassignment measures. | Counts and percentage | Groupings by technician; there is no single productivity score. | Analyze workload distribution without reducing performance to one metric. | Technicians and workload distribution are entirely synthetic. |
| RecurrenceTicket with a previous occurrence in the same unit, category, and root cause within 30 days. | % and tickets | Recurring tickets in the window ÷ total filtered tickets. | Identify repeated patterns that warrant root-cause investigation. | The rule depends on the three available dimensions and configured window. |
| Root causeTicket distribution by the consolidated rootCause field. | Tickets | Count grouped by rootCause value. | Locate concentrations and guide investigation in the scenario. | Causes are synthetic categories, not conclusions from a real investigation. |
Percentage of tickets with an applicable resolution SLA marked as met.
Tickets in open, in-progress, pending, or awaiting-vendor status.
Average resolution time for resolved or closed tickets.
Open tickets with resolution deadline consumption between 75% and 100%.
Critical-ticket slice based on P1 and P2 priorities.
Operational profile by technician with open, closed, overdue, SLA, and reassignment measures.
Ticket with a previous occurrence in the same unit, category, and root cause within 30 days.
Ticket distribution by the consolidated rootCause field.
The application, endpoints, and confirmed contracts are presented according to their actual access level.
Public application
Functional Vercel deployment with a landing page, dashboards, APIs, and a demonstration dataset.
Open evidencePublic endpoint
Public endpoint for checking service and configured-source status.
Open evidencePublic endpoint
Public endpoint with aggregates from the published app's current database. It changes with use, so its figures do not match the 780-ticket snapshot this case analyses.
Open evidencePrivate source code
Verifiable technical evidence is documented in this case study.
Code reference
Fields, enums, and structures used by data, persistence, and views.
Code referencesrc/types/ticket.ts
Code reference
Demonstration scope, commands, stack, data, architecture, limitations, and deployment.
Code referenceREADME.md
Code reference
Deterministic generator and seed that reproduce the 780 demonstration tickets.
Code referencesrc/data/tickets.ts · prisma/seed.ts
Code reference
Functions for SLA, backlog, MTTR, groupings, recurrence, and risk.
Code referencesrc/lib/metrics.ts · src/lib/analytics-v2.ts
Code reference
Dashboard composition, KPI cards, Recharts charts, filters, and operational table.
Code referencesrc/components/dashboard/dashboard-client.tsx · kpi-card.tsx · chart-card.tsx
Code reference
Definitions, formulas, calendars, risk ranges, and metric limitations.
Code referencedocs/kpi-rules.md · docs/analytics-v2.md
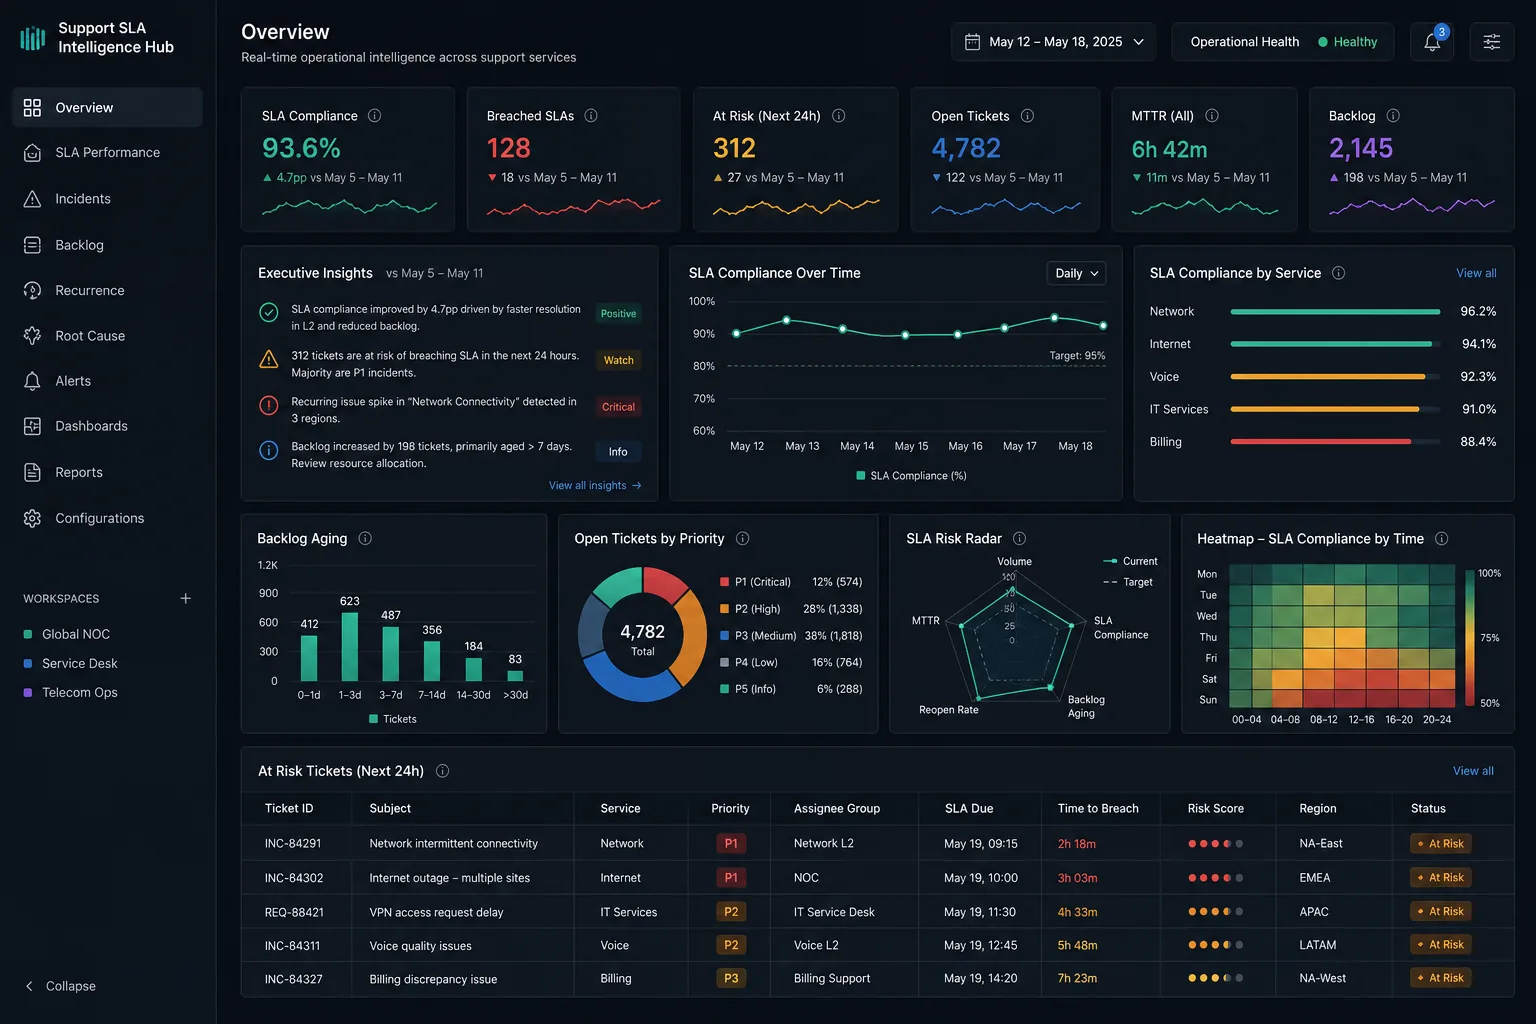
Indicators calculated from the synthetic dataset of 780 tickets. They do not represent outcomes achieved in a live operation.
The images document the product's visual direction. Values shown in the mockups do not replace the audited indicators from the current seed.
Next project
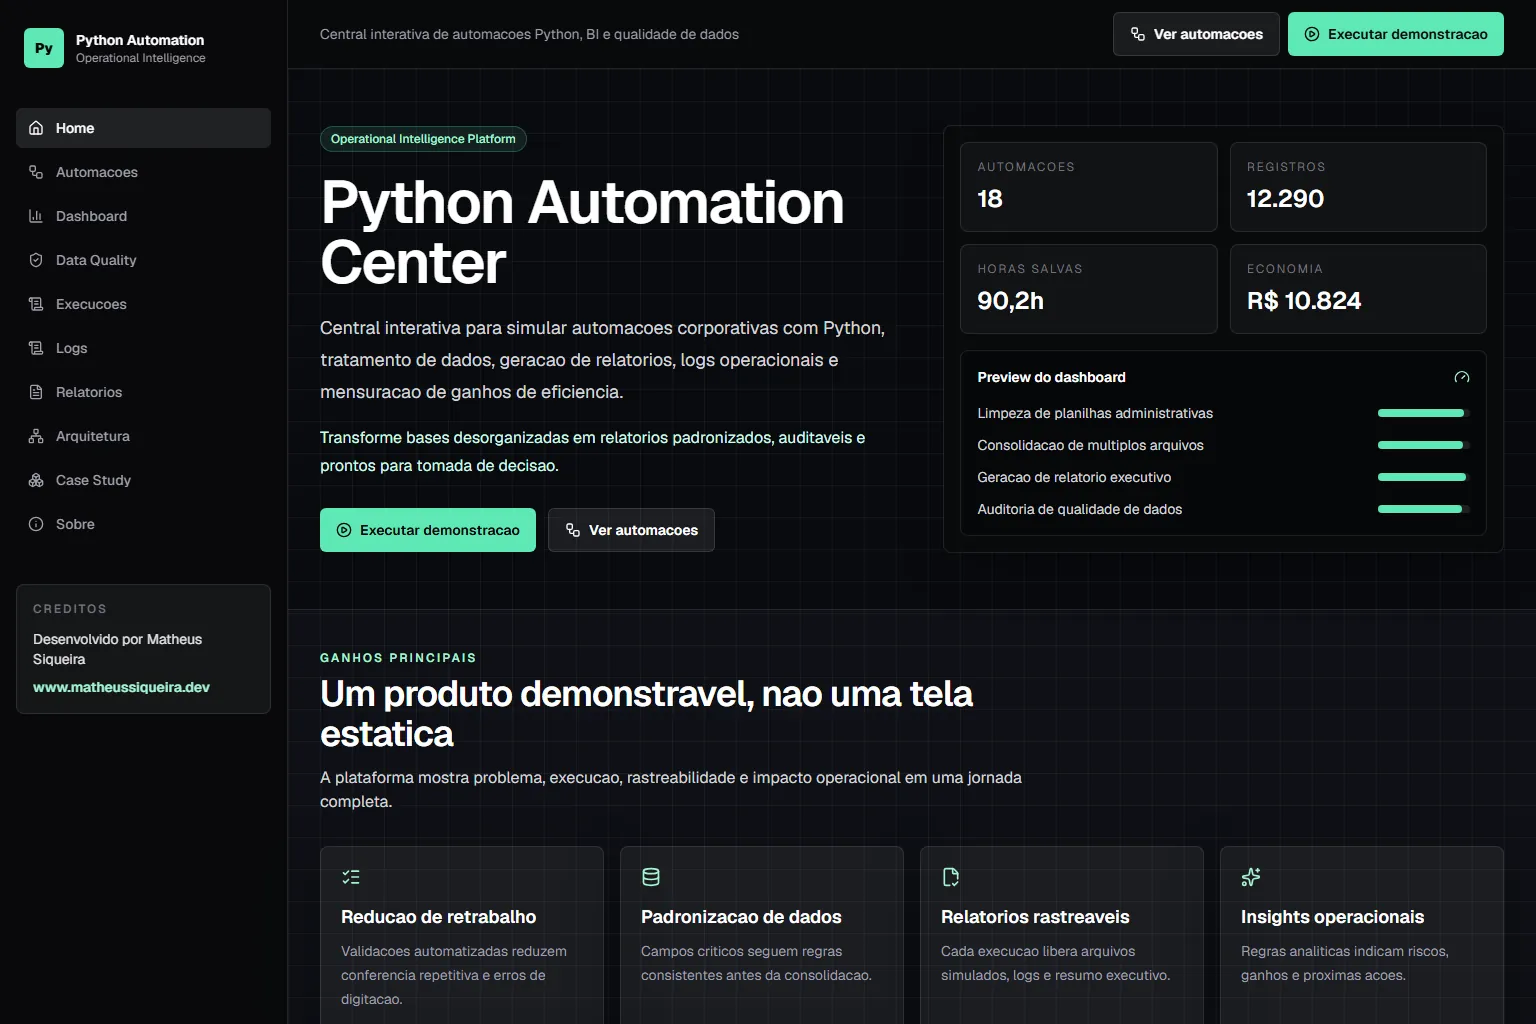
Corporate automation center simulating spreadsheet cleaning, file consolidation, report generation, operational logs, and before/after comparisons to demonstrate efficiency gains.
View full case