Back to projects

Project case study

  • Demonstration project
  • Anomaly detection
  • Demo with a simulated series
  • Private repository

Operational Anomaly Detection

Unsupervised anomaly detection on operational metrics, with WebSocket alerts and a D3 chart.

Radar that detects deviations in operational metrics with a per-metric Isolation Forest and sends alerts over WebSocket. The published API is offline; the dashboard shows a series simulated in the browser.

  • Unsupervised detection
  • One model per series
  • Real-time alerts
  • Hardened API
My roleEnd-to-end development: API, model, real time and dashboard
Technologies used
  • FastAPI
  • scikit-learn
  • SQLAlchemy
  • PostgreSQL
  • WebSocket
  • React
  • D3.js
  • 1 more technology

Private repository; audited reference on the main branch, commit 67fd464, with green CI.

Private source codeVerifiable technical evidence is documented in this case study.
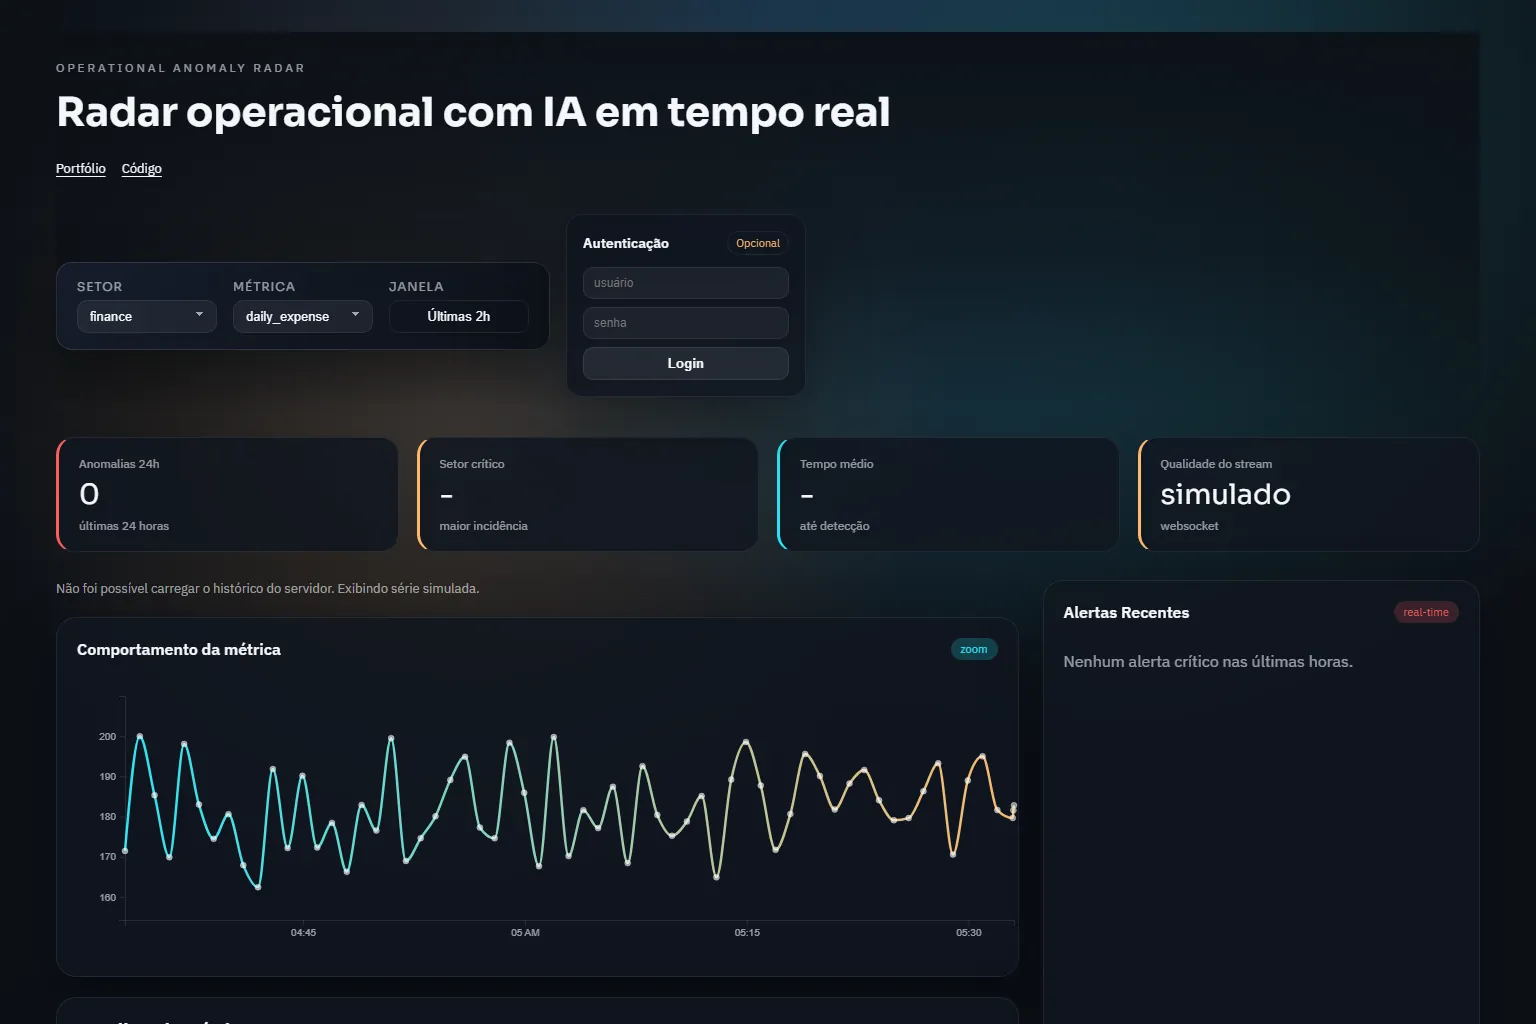
Operational Anomaly Radar home: source, metric and window filters, indicators and a simulated time-series chart.
DETECCAO-DE-ANOMALIAS-OPERACIONAIS.VERCEL.APP / HOME PAGE

Summary

Summary

Deviations in operational metrics are often noticed late, by someone watching dashboards. This radar trains an Isolation Forest for each source and metric, normalises the score between 0 and 1 and, above 0.85, stores the anomaly and notifies the dashboard over WebSocket.

Problem

Fixed per-metric thresholds raise false alarms when series have different scales and noise, and reviewing dashboards by hand does not scale.

My role

Individual project: ingestion, model, persistence, real time, API security, dashboard and tests.

Backend test functions
86
Private repository / count of def test_ in backend/tests / commit 67fd464
Required minimum coverage
80%
Private repository / backend/pytest.ini, green CI / commit 67fd464
Points in the model window
200
Private repository / configuration in backend/app/core/config.py / commit 67fd464

Data and assumptions

The API receives metrics over REST in batches of up to 500. In the deployment, the API does not respond and the dashboard generates a simulated series so the interface is never empty.

Model window
200 points
Minimum to score
50 points
Anomaly threshold
0.85
Cached keys
1,000 (LRU)
Data structure

Modeled entities

  • Metric (source, name, value, time)
  • Anomaly (score, model, time)

Architecture

Two services on the same Vercel origin: the API at /api/* and the dashboard everywhere else.

  1. Ingestion

    Authenticated REST route that processes the batch in a thread pool.

  2. Detection

    Isolation Forest per source:metric key, with a normalised score.

  3. Persistence

    SQLAlchemy over PostgreSQL for metrics and anomalies.

  4. Real time

    WebSocket fan-out, with the token as a subprotocol.

  5. Dashboard

    React with D3: series, anomalous points, feed and backoff reconnection.

Model indicators

What the radar computes for each point it receives.

DefinitionUnitCalculation ruleUseLimitation
Anomaly scoreHow isolated the point is in the series' recent window.0 to 1Isolation Forest score normalised by min-max over the training window, clipped between 0 and 1.Decide whether the point becomes an anomaly.Values outside the training range saturate at 1.
ThresholdSingle cut above which a point is an anomaly.scoreConfiguration constant: 0.85.Store the anomaly and send the alert.It does not adapt to the series' seasonality.

Anomaly score

How isolated the point is in the series' recent window.

Unit
0 to 1
Calculation rule
Isolation Forest score normalised by min-max over the training window, clipped between 0 and 1.
Use
Decide whether the point becomes an anomaly.
Limitation
Values outside the training range saturate at 1.

Threshold

Single cut above which a point is an anomaly.

Unit
score
Calculation rule
Configuration constant: 0.85.
Use
Store the anomaly and send the alert.
Limitation
It does not adapt to the series' seasonality.

Technical decisions

Univariate Isolation Forest per metric

Reason
One simple model per series, with no labelled data.
Consequence / trade-off
It loses seasonality and cross-metric context; it only scores after 50 points.

Clipped min-max normalisation

Reason
It allows a single threshold for every series.
Consequence / trade-off
The model trains once per key; it only retrains through the /train endpoint.

Hybrid strategy by highest score

Reason
It combines an autoencoder and the Isolation Forest when TensorFlow is installed.
Consequence / trade-off
The autoencoder is off by default; in practice detection is the Isolation Forest alone.
Additional technical decisions

1,000-key LRU cache

Reason
Keys come from the client; memory needs a limit.
Consequence / trade-off
An evicted key loses its model state.

Security fail-fast

Reason
The API refuses to start in production with weak secrets.
Consequence / trade-off
Without the right variables, the deployment answers 500, as it does today.

Evidence

Application verified without sign-in; code paths checked in the private repository, commit 67fd464.

Public application

Published dashboard

Interface with indicators, feed and chart; it shows a simulated series while the API is down.

Open evidence

Code reference

Per-metric model

Window, minimum, training and score normalisation.

Code referencebackend/app/ml_models/isolation_forest.py

Code reference

Ingestion and alert

Stores the metric, scores it, stores the anomaly and broadcasts.

Code referencebackend/app/services/ingestion.py

Code reference

Dashboard WebSocket

Receives alerts and reconnects with exponential backoff.

Code referencefrontend/src/hooks/useOperationalStream.ts

Implementation references

Code reference

Hardening

JWT, rate limiting, body limit and refusal with weak secrets.

Code referencebackend/app/core/config.py

Private source code

Private repository

Private source code; the published application is the public evidence.

Engineering measures

measured
86
Backend tests
Count of test functions; 52 of them on security.
configuration
80%
Coverage required by pytest
Configuration in backend/pytest.ini, with green CI.
configuration
500
Metrics per batch
Ingestion route limit.

The project has no operational result: there is no labelled dataset and no client. The measures below are engineering measures.

Private repository, commit 67fd464.

What the project demonstrates

  • Explainable anomaly detection.
  • Asynchronous API with real protections.
  • Real-time alerts over WebSocket.
  • Series visualisation in D3.

Limitations and next steps

Limitations

  • The published API answers HTTP 500; the dashboard shows simulated data.
  • Without a labelled dataset, precision and recall are not measured.
  • TimescaleDB hypertables are not created; the database works as plain PostgreSQL.

Next steps

  • Configure the deployment database so the API responds again.
  • Automatic retraining over a sliding window.
  • A labelled set to measure precision and recall.

Video and media

Project demonstration video.

Capture of the published home page.

Operational Anomaly Radar home: source, metric and window filters, indicators and a simulated time-series chart.

Optional technical details

How to run
  1. The repository is private; the steps below apply to anyone with access.
  2. cp .env.example .env at the project root.
  3. docker compose up --build and open the dashboard at http://localhost:5173
  4. Without Docker: uvicorn app.main:app --reload and, in the frontend, npm ci && npm run dev

Next project

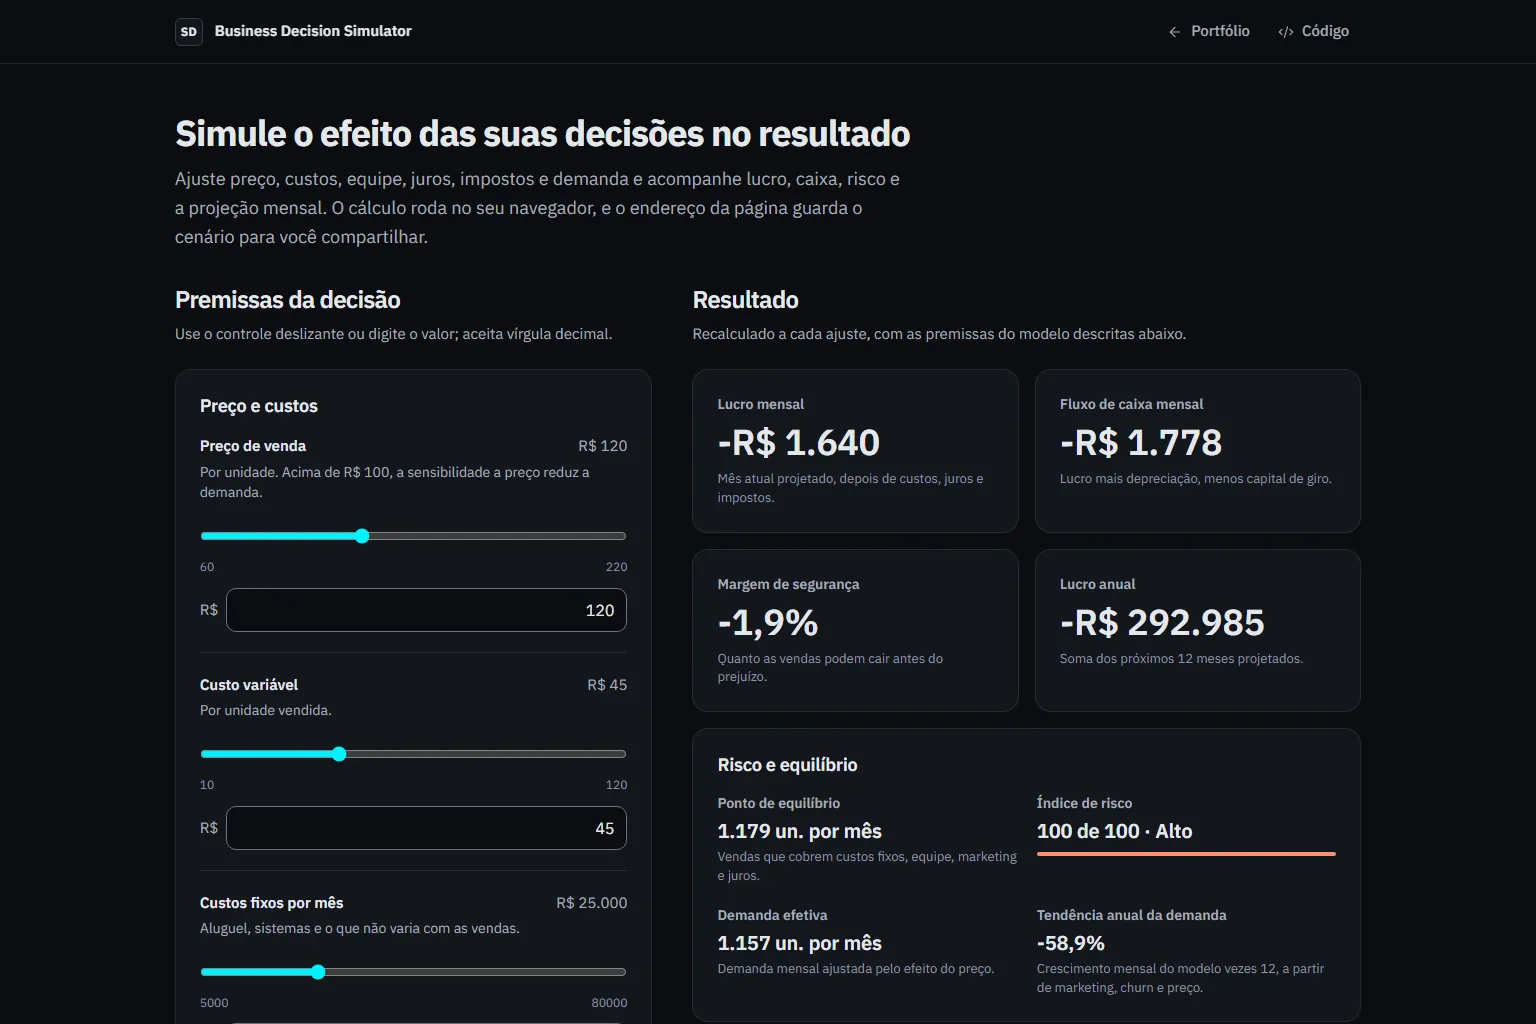
Business Decision Simulator

Web simulator that projects profit, cash flow, risk and break-even from 10 business levers, with the calculation running in the browser.

View full case