Back to projects

Project case study

Business Decision Simulator

Web simulator that projects profit, cash flow, risk and break-even from 10 business levers, with the calculation running in the browser.

My roleAnalyst/Developer
Technologies used
  • Next.js
  • TypeScript
  • Tailwind CSS
  • Recharts
  • Python
  • FastAPI
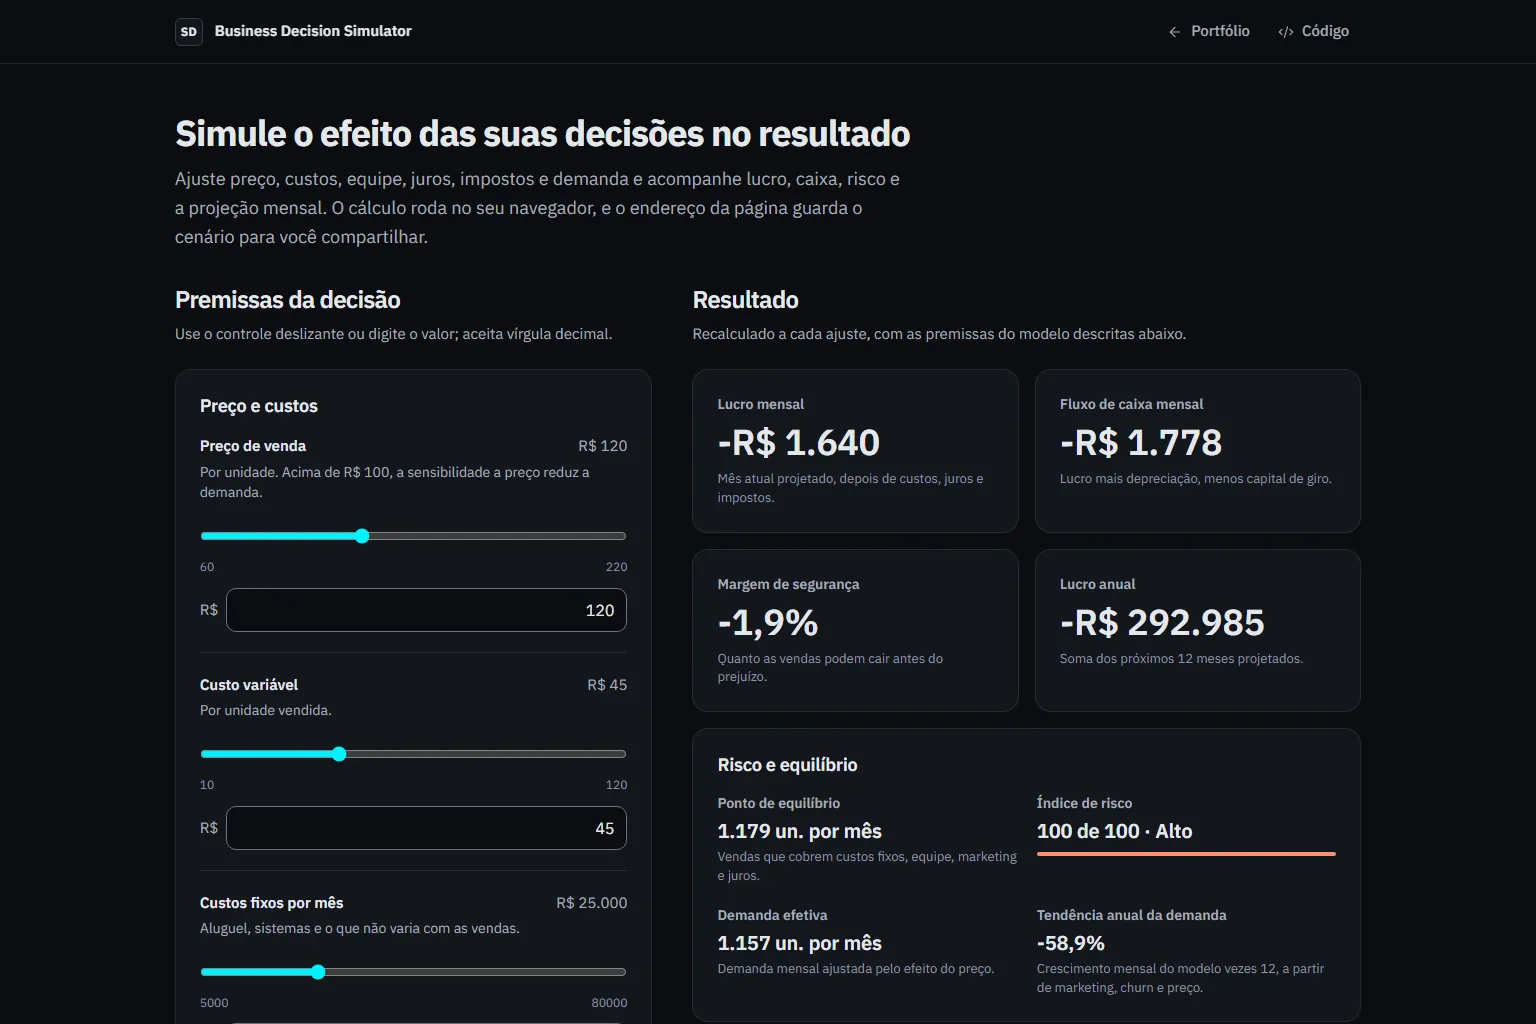
Simulator with the price and cost inputs on the left and the profit, cash and risk results on the right.
simulacao-estrategica-decisao.vercel.app / Home page

Problem

Changing one assumption means redoing calculations across many cells.

The effect of price on demand is usually left out of the calculation.

Solution

Architecture at a glance
  • 10 levers entered on the page, each with a valid range.
  • Fixed model assumptions: salary per person, debt, working capital, depreciation and seasonality.
  • A 12-month horizon starting from the current month.
Technical decisions
  1. TypeScript simulation engine in the browser, with no server and no database.
  2. A single demand model for both the indicators and the projection.
  3. Scenario kept in the URL, updated 300 ms after the last change.

Result

Input levers
10
Published demo / editable fields in the interface / 13 Oct 2026
Parity scenarios
13
Public repository / fixtures/simulation-golden.json, TS and Python / v0.3.0
End-to-end tests
20
Public repository / e2e/simulator.spec.ts with Playwright and axe / v0.3.0

Shipped a published simulator that recalculates on every assumption change.

  • Auditable financial modeling: revenue, costs, taxes, cash and break-even.
  • Porting a model from Python to TypeScript with parity tests.
  • Next.js with strict TypeScript, Vitest and Playwright.
  • Accessible, responsive interface from 320 to 1440 px.

Learnings and limitations

  • Fixed assumptions and linear growth: the projection compares decisions within the model and is not a forecast.
  • One scenario at a time; to compare, open two links.
  • Interface in Portuguese only, with values in Brazilian reais.

More about the project

Full case details, collapsed for optional reading.

Full description

Web tool to test pricing, cost, headcount and marketing decisions and see their effect on profit, cash and risk over the next 12 months.

The calculation runs in the browser, in TypeScript, and reproduces the reference Python engine across 13 shared test scenarios.

The scenario lives in the page address, written with a 300 ms delay, so someone else can review it from the link.

The chart drops its animation when the system asks for reduced motion and has an alternative table with the same numbers.

Next.js and TypeScript with the simulation engine in the browser, Recharts charts and a Python/FastAPI reference engine that keeps the calculations in parity.

Unified the model: indicators and projection use the same effective demand.

Every formula is tested in both engines, which makes the calculation verifiable.

Problem

  • Without a stable link, it is hard to review a scenario with someone else.
  • Formulas scattered across spreadsheets have no tests.

What the page shows

  • Monthly profit, cash flow, safety margin and annual profit in Brazilian reais.
  • Risk index, break-even point and effective demand after the price effect.
  • Month-by-month revenue and profit for 12 months, with a table alternative to the chart.

How the model works

  • Effective demand is the stated demand adjusted for price, with a factor between 0.6 and 1.3.
  • Monthly profit is the first projected month; annual profit sums 12 months.
  • Fixed assumptions (salary, debt, working capital, depreciation and seasonality) are shown on the page.
Features and highlights
  • Fields with a slider and a numeric input that accepts a decimal comma.
  • An empty or invalid field shows the error and keeps the last result.
  • Shareable link that restores the scenario and drops invalid values.
  • Chart with a data table and no animation when the system asks for reduced motion.
  • Parity between the TypeScript and Python engines checked in CI.
  • Accessibility checked with axe at three screen widths.
  • Static page on Vercel with CSP and security headers.
  • No accounts, no database and no personal data collected.
Technical architecture and data
  • FastAPI reference API with the same engine in Python, used in the parity tests.

Technical architecture

How the case was designed as a product

Web simulator that projects profit, cash flow, risk and break-even from 10 business levers, with the calculation running in the browser.

Next.jsFrameworkTypeScriptLanguageTailwind CSSFrameworkRechartsVisualizationPythonLanguageFastAPIFramework

Data used

  • 10 levers entered on the page, each with a valid range.
  • Fixed model assumptions: salary per person, debt, working capital, depreciation and seasonality.
  • A 12-month horizon starting from the current month.
  • 13 reference scenarios computed by the Python engine.

Core components

  • Fields with a slider and a numeric input that accepts a decimal comma.
  • An empty or invalid field shows the error and keeps the last result.
  • Shareable link that restores the scenario and drops invalid values.
  • Chart with a data table and no animation when the system asks for reduced motion.

Technical decisions

  • Auditable financial modeling: revenue, costs, taxes, cash and break-even.
  • Porting a model from Python to TypeScript with parity tests.
  • Next.js with strict TypeScript, Vitest and Playwright.
  • Accessible, responsive interface from 320 to 1440 px.

Trade-offs

  • Fixed assumptions and linear growth: the projection compares decisions within the model and is not a forecast.
  • One scenario at a time; to compare, open two links.
  • Interface in Portuguese only, with values in Brazilian reais.
How to run
  1. Open the published version from the project button.
  2. To run it locally, with Node 24: cd frontend, npm ci and npm run dev.
  3. Reference API, with Python 3.12: cd backend, pip install -r requirements-dev.txt and uvicorn app.main:app --port 8000.
  4. Tests: npm test and npm run test:e2e in the frontend; python -m pytest in the backend.
Credits

Developed by Matheus Siqueira - https://www.matheusdev.tech

Next projectDriver Monitoring System

Driver attention monitor with MediaPipe in the browser and a local Python engine; the demo opens with simulated metrics.

View full case