Data used
- A synthetic, deterministic base of 2,700 records: 180 days, 5 products and 3 channels.
Project case study
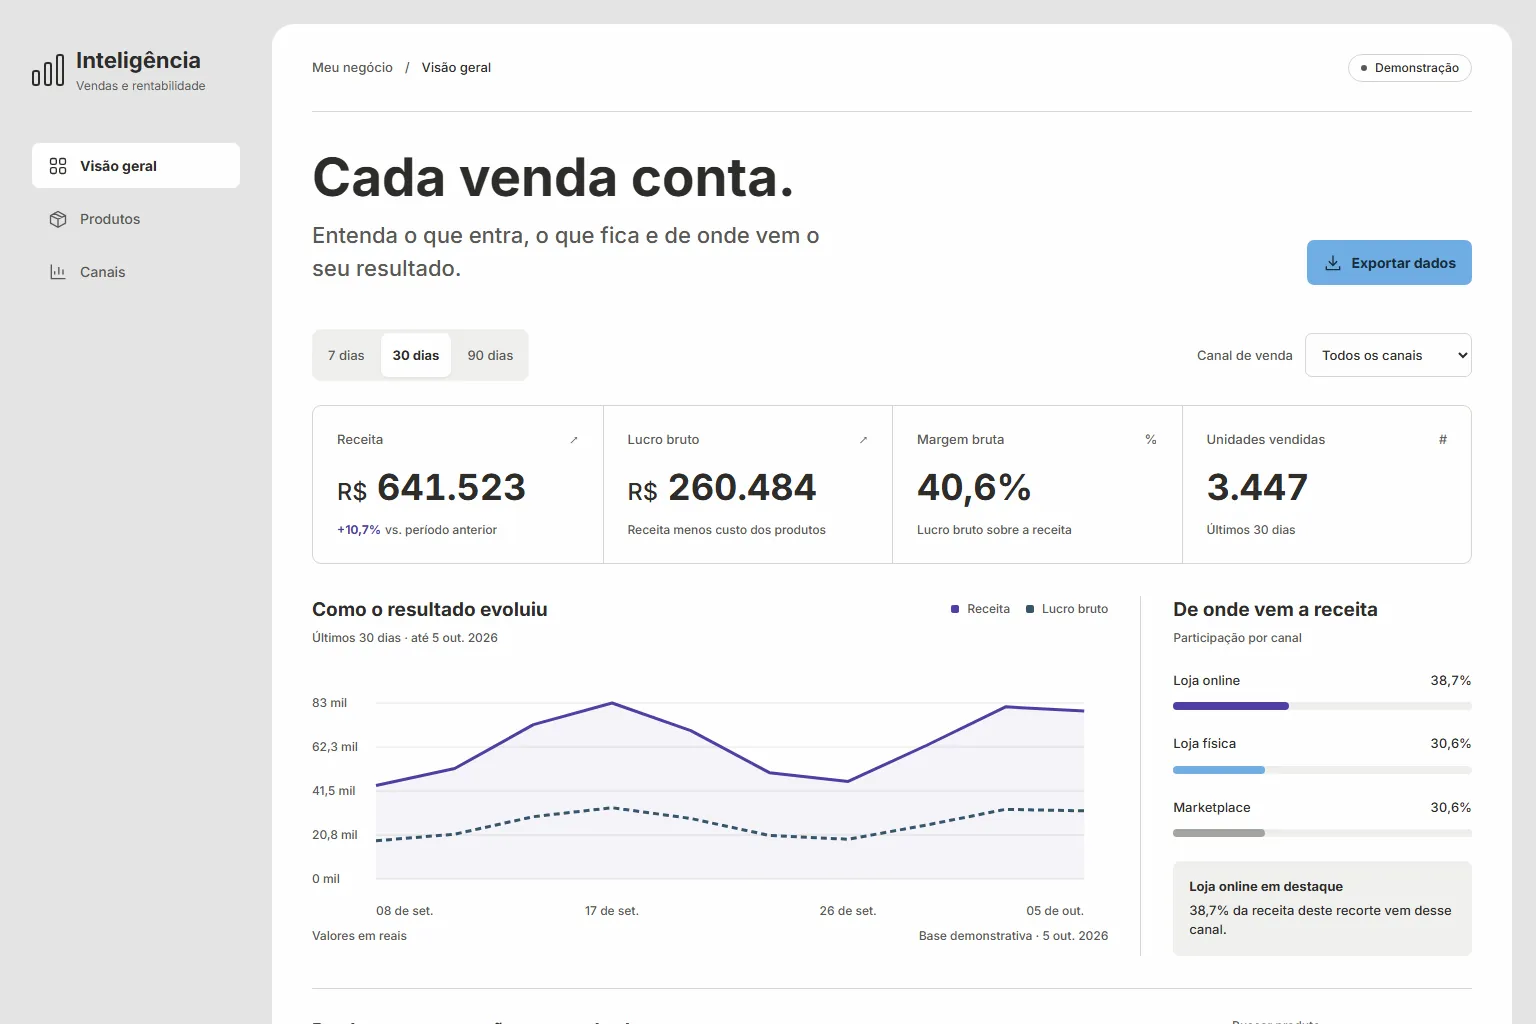
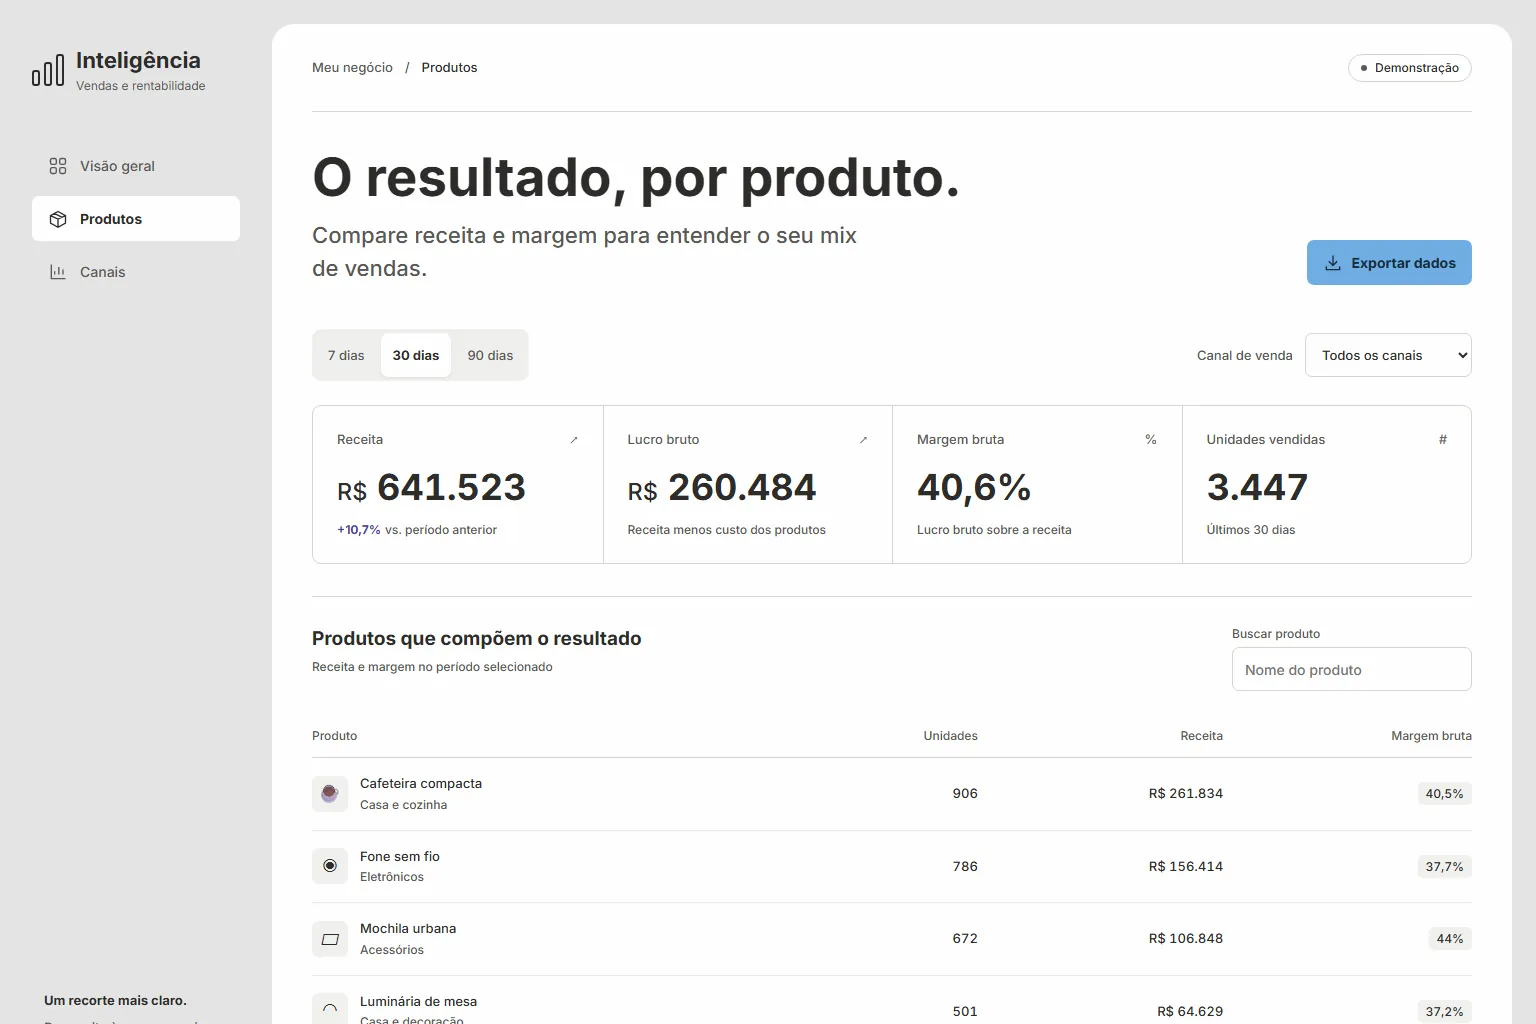
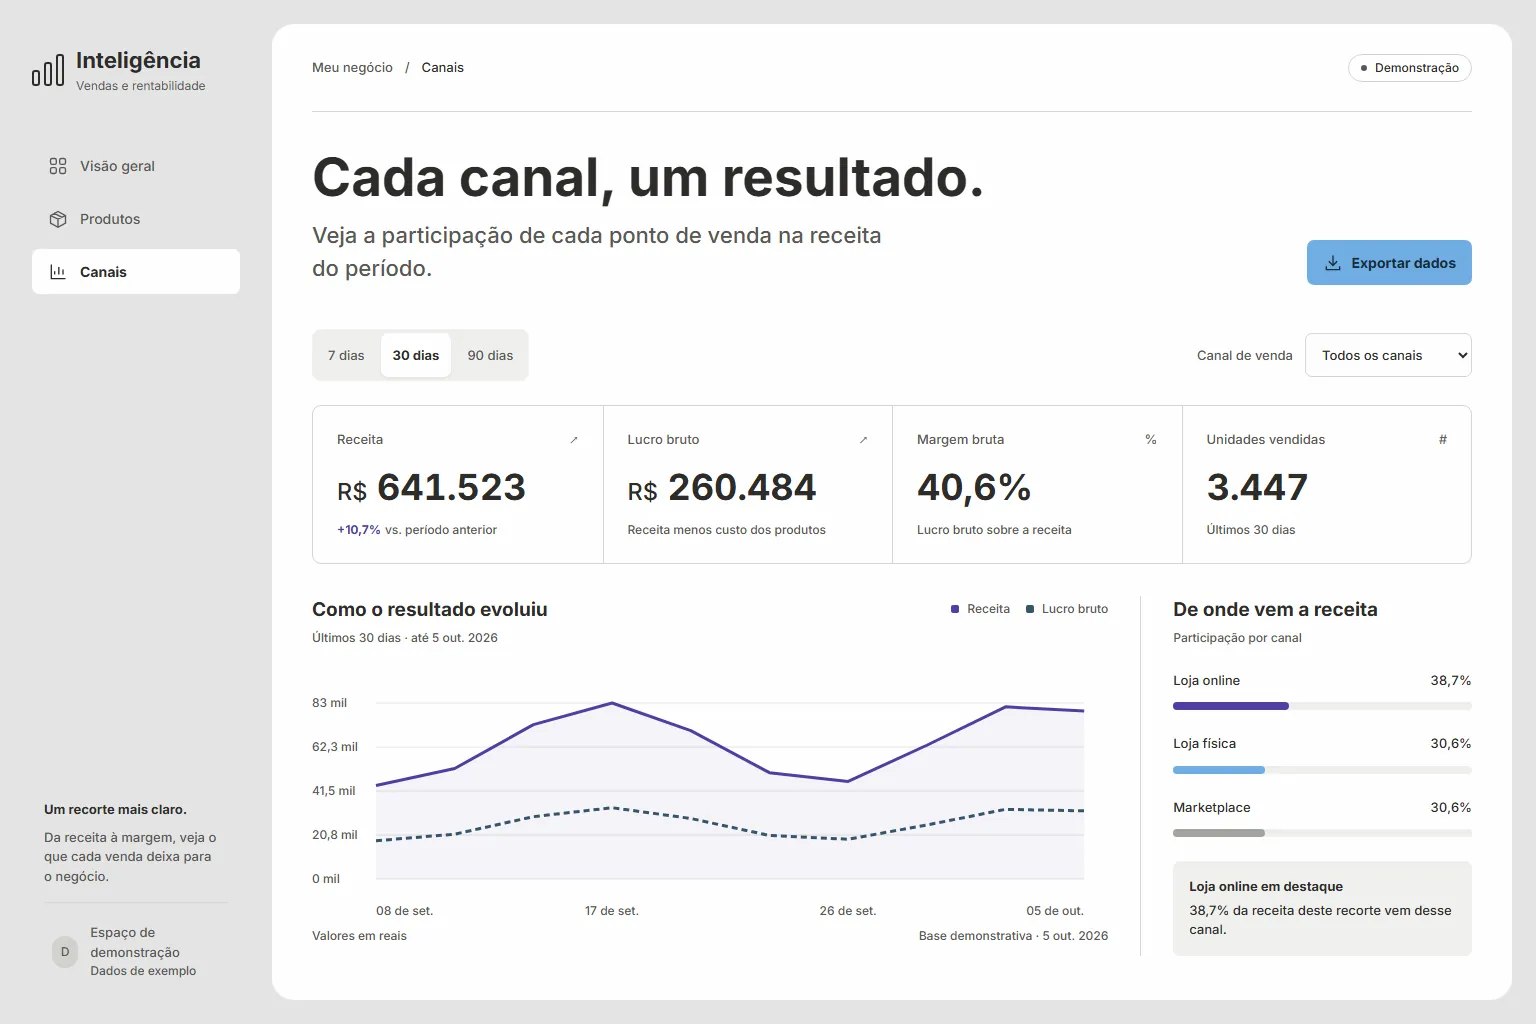
Sales dashboard showing revenue, gross profit and margin by period, channel and product, in HTML, CSS and JavaScript.
Revenue alone does not show how much each sale leaves.
Comparing periods, channels and products in a spreadsheet is slow.
A lean dashboard that puts each sale's margin in view, built as an academic project.
Full case details, collapsed for optional reading.
Every Sale Counts is a sales dashboard built as an end-of-semester academic project.
The base is synthetic and deterministic: 2,700 records over 180 days, 5 products and 3 channels, with values in whole cents.
The dashboard filters by period and channel, compares each indicator with the previous period and draws revenue and gross profit in SVG, with no library.
There are product and channel views, table search and a CSV export marked as a demonstration.
Dependency-free HTML, CSS and JavaScript, an SVG chart and Playwright tests; static hosting on Vercel.
Technical architecture
Sales dashboard showing revenue, gross profit and margin by period, channel and product, in HTML, CSS and JavaScript.
Developed by Matheus Siqueira - https://www.matheusdev.tech
FastAPI service that catalogues books, searches by title, author and year, and fills in metadata from the ISBN via OpenLibrary.
View full case