Back to projects

Project case study

  • Demonstration project
  • Marketing Analytics and BI
  • Simulated data
  • Private repository
  • Functional application

Ad Performance Intelligence

An analytics dashboard that consolidates a simulated paid-media scenario to compare channels, model metrics, and support budget decisions with explainable rules.

Independent demonstration project with no institutional affiliation or reproduction of confidential client data. Google Ads and Meta Ads are represented dataset channels; there are no active platform integrations.

  • Deterministic synthetic data
  • Cross-channel analysis
  • Calculated metrics
  • Rule-based recommendations
  • Demonstration simulator
My roleMarketing Analytics, Business Intelligence, and Web Development
Technologies used
  • Next.js 15
  • TypeScript
  • React
  • Recharts
  • TanStack Table
  • Zod
  • Three.js
  • 1 more technology

Private repository; audited reference on the main branch, commit 87fc21b.

Private source codeVerifiable technical evidence is documented in this case study.
Published Portuguese overview of the Ad Performance Intelligence dashboard.
Published Portuguese dashboard capture used as the technical case-study cover.

Overview

Summary

Ad Performance Intelligence is a demonstration Marketing Analytics and BI product that organizes simulated Google Ads and Meta Ads metrics into an executive view of spend, efficiency, funnel, and attributed return.

Problem

Channel comparison loses clarity when spend, delivery, conversion, and return are read in isolation or with inconsistent denominators.

My role

Analytics scenario modeling, implementation of calculations and rules, web experience development, documentation of assumptions, and validation of technical contracts.

Overall ROAS
18.5x
Published demo / /api/kpis over 1,800 simulated records / 13 Oct 2026
Analyzed conversions
12,798
Published demo / /api/kpis over 1,800 simulated records / 13 Oct 2026
Consolidated CTR
3.3%
Published demo / /api/kpis over 1,800 simulated records / 13 Oct 2026

Data and assumptions

The data is synthetic, deterministic, and defined in versioned TypeScript modules. The published application does not query Google Ads, Meta Ads, a CRM, or a data warehouse.

The public scenario contains ten campaigns and 1,800 daily facts from December 3, 2025 through May 31, 2026. Values are illustrative and do not represent clients, accounts, or business results.

Origin
TypeScript modules under src/data
Classification
Synthetic and simulated data
Grain
Campaign by day
Coverage
10 campaigns · 180 days · 1,800 facts
Channels
Google Ads and Meta Ads
Persistence
No database, upload, or writes
Data structure

Modeled entities

  • Campaign: channel, objective, region, period, budget, and status.
  • DailyPerformance: delivery, cost, leads, conversions, and attributed revenue by campaign and day.
  • Lead: simulated source, score, quality, intent, and stage.
  • Channel, Benchmark, and Recommendation: channel context, demonstration references, and heuristic rules.

Analytics architecture

Five layers reflect the public code and published application without describing the project as an official integration, automated ETL, or data warehouse.

  1. 1. Data source

    TypeScript seeds define ten campaigns and fixed parameters for Google Ads and Meta Ads.

  2. 2. Deterministic loading

    Local modules generate 180 days of facts from a fixed start date and reproducible mathematical functions.

  3. 3. Modeling

    campaignId relates campaigns, daily facts, and leads; channel, objective, and region act as dimensions.

  4. 4. Calculations and rules

    TypeScript functions calculate rates and costs, while heuristic rules generate recommendations and estimates.

  5. 5. Visualization and decisions

    Next.js, Recharts, and TanStack Table present KPIs, comparisons, funnel, filters, and simulator.

Implemented metrics

The formulas below were verified in the public code. Divisions use safeDivide and return zero when the denominator is zero.

DefinitionUnitCalculation ruleUseLimitation
CTRImpressions that resulted in a click.%clicks ÷ impressions × 100; a zero denominator returns 0.Read top-of-funnel response.Does not measure quality or downstream conversion.
CPCAverage cost per click.BRL per clickspend ÷ clicks; a zero denominator returns 0.Compare traffic acquisition.Does not demonstrate traffic value or intent.
CPLAverage cost per generated lead.BRL per leadspend ÷ leads; a zero denominator returns 0.Assess lead capture.A simulated lead does not equal a sale.
CPAAverage cost per attributed conversion.BRL per conversionspend ÷ conversions; a zero denominator returns 0.Compare final actions across campaigns.Demonstration attribution, without incrementality.
Conversion rateClicks that resulted in an attributed conversion.%conversions ÷ clicks × 100; a zero denominator returns 0.Relate traffic to final actions.Does not isolate channel, offer, or sales-service effects.
ROASAttributed revenue divided by media spend.multiplierattributed revenue ÷ spend; a zero denominator returns 0.Contextualize attributed return.Not ROI, total business revenue, or profit.
Budget utilizationShare of campaign budget represented by spend.%spend ÷ budget × 100; a zero denominator returns 0.Track simulated budget use.Fixed budget without platform pacing.
Average lead qualityMean lead score in the selected view.pointssum of lead scores ÷ lead count; an empty collection returns 0.Add qualitative context to lead volume.Synthetic assumption, not a trained model.
Campaign Efficiency ScoreScore used to rank efficiency signals.0 to 100Combines normalized CTR, CPC, CPL, conversion rate, ROAS, and lead quality.Compare campaigns within the same scenario.Heuristic weights; not a forecast or guarantee.

CTR

Impressions that resulted in a click.

Unit
%
Calculation rule
clicks ÷ impressions × 100; a zero denominator returns 0.
Use
Read top-of-funnel response.
Limitation
Does not measure quality or downstream conversion.

CPC

Average cost per click.

Unit
BRL per click
Calculation rule
spend ÷ clicks; a zero denominator returns 0.
Use
Compare traffic acquisition.
Limitation
Does not demonstrate traffic value or intent.

CPL

Average cost per generated lead.

Unit
BRL per lead
Calculation rule
spend ÷ leads; a zero denominator returns 0.
Use
Assess lead capture.
Limitation
A simulated lead does not equal a sale.

CPA

Average cost per attributed conversion.

Unit
BRL per conversion
Calculation rule
spend ÷ conversions; a zero denominator returns 0.
Use
Compare final actions across campaigns.
Limitation
Demonstration attribution, without incrementality.

Conversion rate

Clicks that resulted in an attributed conversion.

Unit
%
Calculation rule
conversions ÷ clicks × 100; a zero denominator returns 0.
Use
Relate traffic to final actions.
Limitation
Does not isolate channel, offer, or sales-service effects.

ROAS

Attributed revenue divided by media spend.

Unit
multiplier
Calculation rule
attributed revenue ÷ spend; a zero denominator returns 0.
Use
Contextualize attributed return.
Limitation
Not ROI, total business revenue, or profit.

Budget utilization

Share of campaign budget represented by spend.

Unit
%
Calculation rule
spend ÷ budget × 100; a zero denominator returns 0.
Use
Track simulated budget use.
Limitation
Fixed budget without platform pacing.

Average lead quality

Mean lead score in the selected view.

Unit
points
Calculation rule
sum of lead scores ÷ lead count; an empty collection returns 0.
Use
Add qualitative context to lead volume.
Limitation
Synthetic assumption, not a trained model.

Campaign Efficiency Score

Score used to rank efficiency signals.

Unit
0 to 100
Calculation rule
Combines normalized CTR, CPC, CPL, conversion rate, ROAS, and lead quality.
Use
Compare campaigns within the same scenario.
Limitation
Heuristic weights; not a forecast or guarantee.

Technical decisions

Deterministic synthetic dataset in TypeScript

Reason
Makes the demonstration reproducible without exposing client accounts, campaigns, or information.
Consequence / trade-off
The scenario does not capture real-platform seasonality, noise, and data quality.

Centralized formulas with safe division

Reason
Keeps CTR, CPC, CPL, CPA, conversion, and ROAS consistent across components and APIs.
Consequence / trade-off
Returning zero prevents invalid values but requires context to distinguish a missing base from real performance.

One local source for UI and Route Handlers

Reason
Makes KPIs and internal responses verifiable without infrastructure or external credentials.
Consequence / trade-off
There is no automatic refresh, persistence, or user isolation.
Additional technical decisions

Explainable heuristic recommendations and simulation

Reason
Rules make assumptions, signals, and suggested actions auditable in the code.
Consequence / trade-off
Outputs do not demonstrate causality, statistical optimization, or a machine-learning model.

Public evidence

Application verified without sign-in; code paths checked in the private repository, main branch, commit 87fc21b.

Public application

Published application

Functional Portuguese dashboard with KPIs, filters, comparisons, recommendations, and a demonstration simulator.

Open evidence

Private source code

Repository at commit 87fc21b

Private snapshot used as the reference for this audit.

Public documentation

Simulated-data strategy

ADR records deterministic data, lack of synchronization, and demonstration-only use.

Code referencedocs/adr/002-data-strategy.md

Code reference

Deterministic daily series

Generates 180 dates and campaign facts from fixed parameters.

Code referencesrc/data/daily-performance.ts

Code reference

Metric functions

Implementation of CTR, CPC, CPL, CPA, conversion, ROAS, utilization, and score.

Code referencesrc/lib/analytics/metrics.ts

Implementation references

Public endpoint

KPI endpoint

Route Handler that aggregates the local dataset and identifies the response as simulated.

Code referencesrc/app/api/kpis/route.ts

Code reference

Recommendation Engine

Heuristic rules with metrics, reasons, suggested actions, and trade-offs.

Code referencesrc/lib/analytics/recommendation-engine.ts

Code reference

Budget simulator

Estimates derived from budget, simulated historical efficiency, and lead quality.

Code referencesrc/lib/analytics/simulator.ts

Code reference

Metric tests

Reproducible cases for CTR, CPC, CPL, ROAS, and efficiency score.

Code referencesrc/tests/metrics.test.ts

Public documentation

Architecture document

Separation across presentation, analytics, validation, data, types, and Route Handlers.

Code referencedocs/architecture.md

Published demonstration scenario

Simulated data
BRL 398,713.16
Aggregated spend
Sum of cost across 1,800 simulated daily facts.
Simulated data
3.33%
Consolidated CTR
Clicks divided by impressions across the full scenario.
Simulated data
18.46x
Demonstration ROAS
Simulated attributed revenue divided by spend.

All three values belong to the application's simulated dataset. They do not represent a media account, client, business improvement, profit, or enterprise impact.

Values reproduced through the public /api/kpis endpoint and the formulas versioned in the audited reference.

Demonstrated capabilities

  • Marketing Analytics and Business Intelligence in a cross-channel scenario.
  • Metric modeling and documentation.
  • Simulated-data quality, consistency, and traceability.
  • Data visualization with Recharts and analytical tables.
  • Development and testing with Next.js, React, TypeScript, and Vitest.

Limitations and next steps

Confirmed limitations

  • The data is synthetic and contains no real client accounts, campaigns, or results.
  • There is no active integration, automatic refresh, database, persistence, upload, or authentication.
  • Attributed revenue and ROAS are demonstrative; they do not measure profit, ROI, or incrementality.
  • Recommendations, benchmarks, and simulator estimates are heuristic; the application is Portuguese-only.

Possible evolutions

  • Integrate official APIs and a persistent historical layer with secure credentials and incremental refresh.
  • Model attribution and monitor data quality, reconciliation, and freshness.
  • Validate recommendations through experiments before any operational use.

Captures of the Portuguese-only published application; all numbers belong to the simulated scenario.
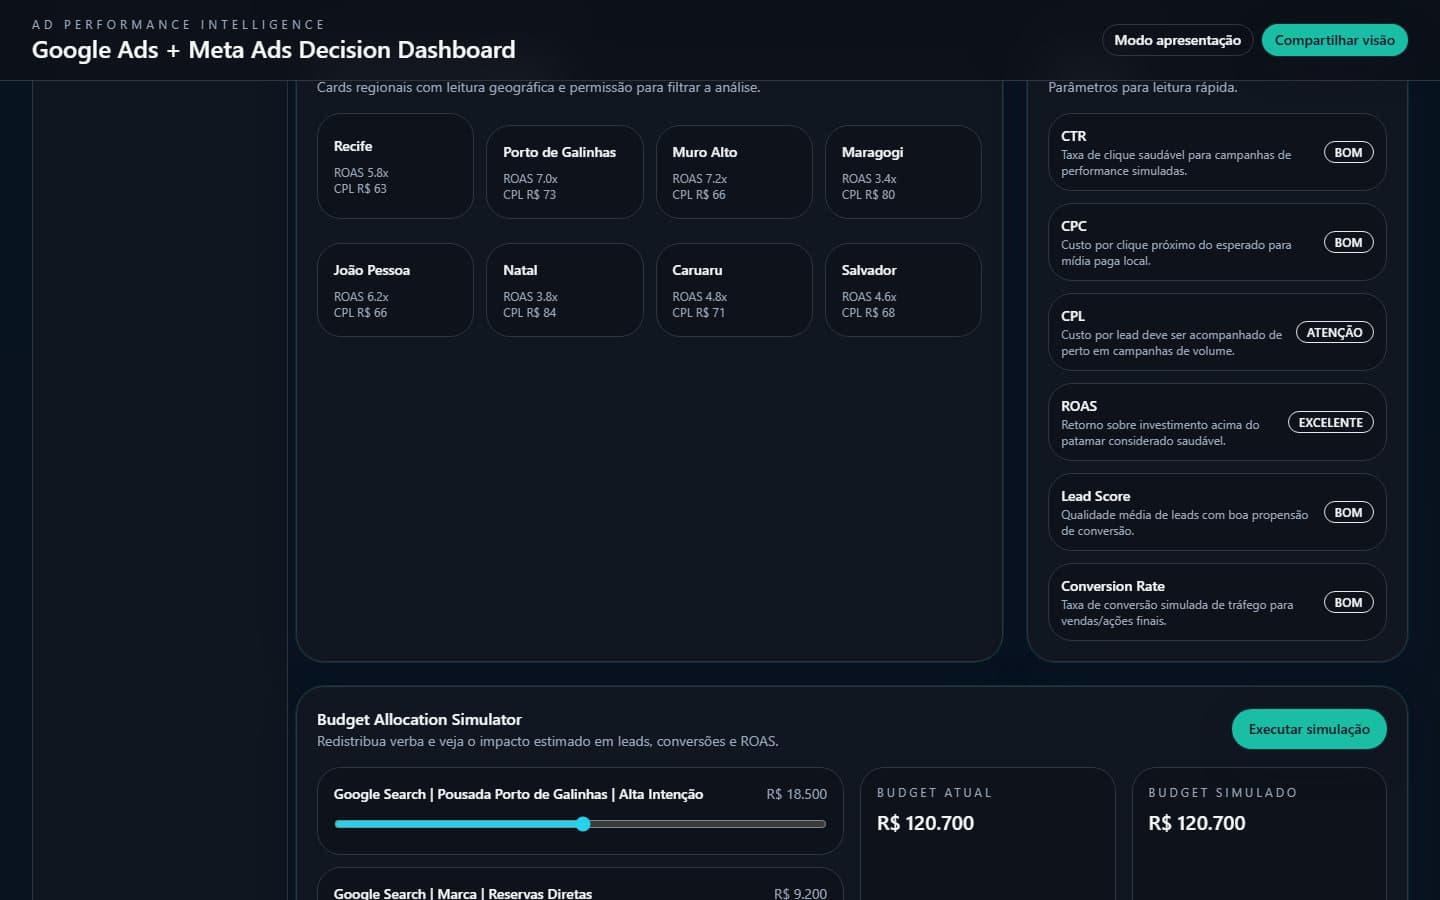

Regional map, benchmarks, and budget simulator in the dashboard.
Published Portuguese application: regional view, demonstration benchmarks, and budget simulator.
Recommendations and detailed campaign analysis in the published product.
Published Portuguese application: heuristic recommendations and disclosure of the project's simulated nature.

Optional technical details

How to run
  1. The repository is private; with access, use the main branch at reference commit 87fc21b.
  2. Run npm install and npm run dev to start the Next.js application.
  3. Use the Route Handlers or the interface to reproduce metrics over the simulated dataset.
  4. Run npm run test to validate the existing formulas and rules.

Next project

Real-Time Hand Gesture Recognition

Recognition of 11 hand gestures from the camera, in the browser, with explainable rules and a CPU fallback.

View full case